You pull the mechanical drawings for a 1990s office building scheduled for a tenant improvement. The HVAC layouts show ductwork that no longer matches what is in the ceiling. The plumbing risers are two feet from where the drawings say they are. Nobody updated anything after the last three buildouts. Now your design team is working off a fiction, and you will not discover the real conditions until someone starts cutting walls.
This is not an edge case. It is the standard state of existing conditions documentation in commercial real estate. The problem is not the buildings; it is the documentation method. Manual field measurement is slow, partial, and dependent on what the crew remembered to measure. MEP drawings produced from LiDAR scanning change that calculus entirely.
What LiDAR Delivers for MEP Documentation
LiDAR scanning captures full MEP system geometry at ±2mm / ±1/8″ accuracy, producing as-built MEP drawings that reflect what actually exists in the field, not what was originally designed. Architects and GCs use these deliverables to eliminate RFIs, reduce field conflicts, and accelerate permit submittals. Scan-to-BIM MEP models in Revit and 2D CAD as-builts in AutoCAD are both available, with turnaround in 5 to 14 business days depending on scope. To understand what LiDAR can document in your building, see our 3D laser scanning services page.
Why As-Built MEP Drawings Fail Before a Project Starts
The gap between original construction drawings and actual field conditions widens every year a building is occupied. Every tenant improvement, every equipment swap, every code-driven pipe reroute adds another layer of deviation. Facility managers rarely commission formal documentation updates after routine modifications. The result: the mechanical, electrical, and plumbing systems shown on 10-year-old drawings may bear only a passing resemblance to what is actually above the ceiling tiles.
The financial exposure from that gap is well documented. According to FMI’s 2023 Construction Risk Report, information deficiencies, including inaccurate existing conditions data, account for a significant share of the cost overruns that plague renovation and TI projects. Change orders triggered by field conflicts run an average of $31,000 on mid-size commercial projects, and RFIs add an average of $1,000 per round in coordinated overhead (Dodge Data and Analytics, 2022 Contractor Productivity Survey).
Manual field measurement, the legacy method for producing as-built MEP drawings, captures point-to-point dimensions but misses routing complexity, elevation data, and the spatial relationship between systems. A crew spending three days on a floor can still miss a 40-foot duct run tucked behind a beam, or misrecord a pipe diameter because they measured over insulation. That missing geometry becomes an RFI the moment a contractor tries to install something in the same space.
What LiDAR Scanning Actually Captures in MEP Systems
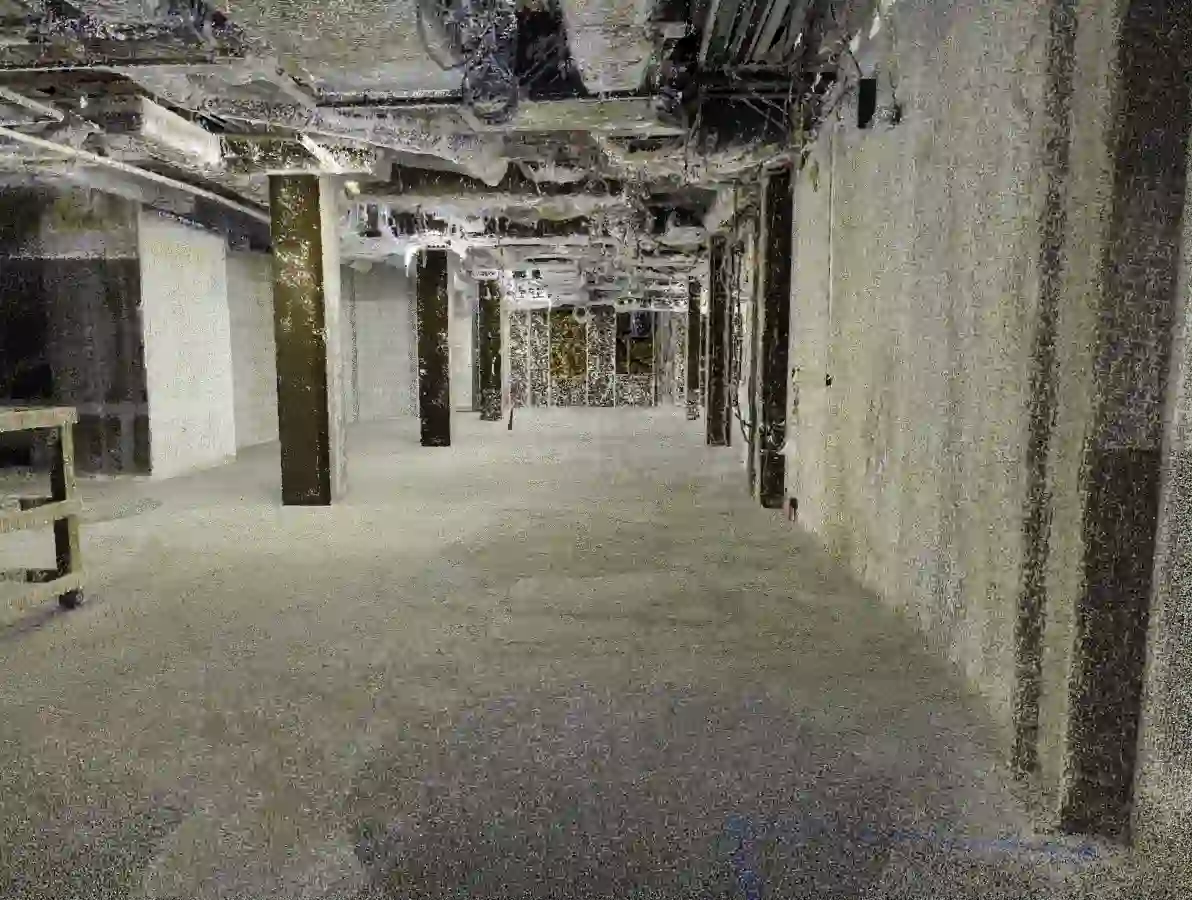
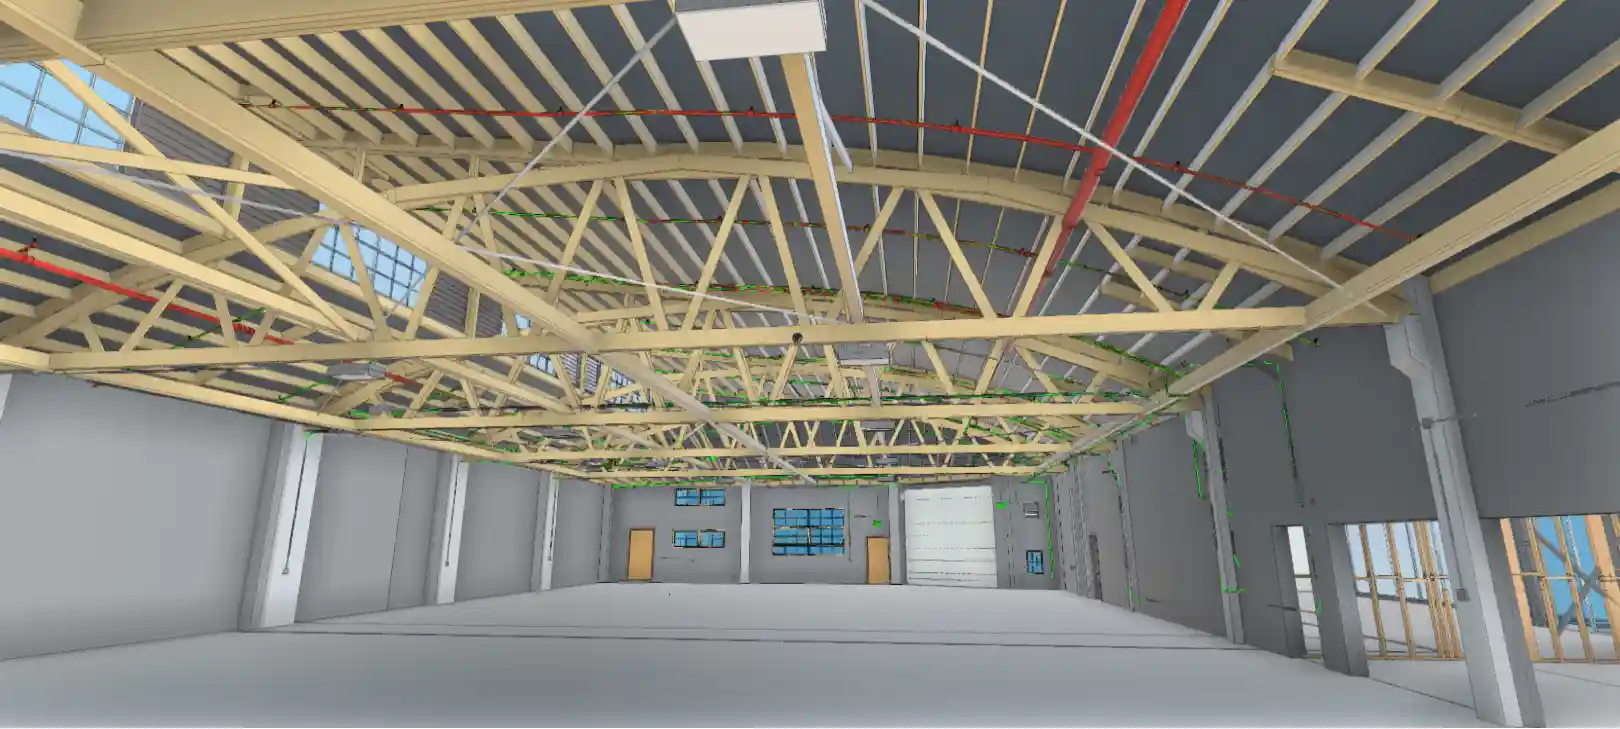
A LiDAR scanner emits millions of laser pulses per second and records the return time of each one. The result is a dense point cloud: a three-dimensional map of every surface the scanner can see, accurate to ±2mm. Applied to MEP documentation, that means the scanner records the exterior geometry of every duct, pipe, conduit tray, equipment unit, and hanger within its sightlines.
In a typical commercial ceiling plenum, a properly executed LiDAR scan captures:
- Primary ductwork: rectangular and round duct mains, with width, height, and elevation verified to ±1/8″
- Branch ductwork: supply and return branches feeding diffusers, including elbows, transitions, and offsets
- Hydronic piping: chilled water, heating hot water, and condenser water lines down to approximately 1.5″ diameter at standard scanning distances
- Fire protection: sprinkler mains and branch lines; small-diameter drops are documented where point density permits
- Electrical systems: cable trays, large conduit runs, switchgear, and panel locations
- Equipment: AHUs, FCUs, pumps, and rooftop units with dimensional footprints and connection points
Small-diameter components below 3/4″ present a real limitation at standard scanning distances. The scanner captures surface geometry, not pipe contents or system identification. MEP documentation from LiDAR is the most complete and accurate for the primary distribution systems, which are also the components that generate the most coordination conflicts.
For a deeper look at how scan data is captured and processed, see our guide to 3D laser scanning services.
From Point Cloud to Deliverable: The LiDAR MEP Documentation Workflow
The scan-to-deliverable workflow for MEP has four stages, each with a direct impact on what the final drawings contain and how reliably they reflect field conditions.
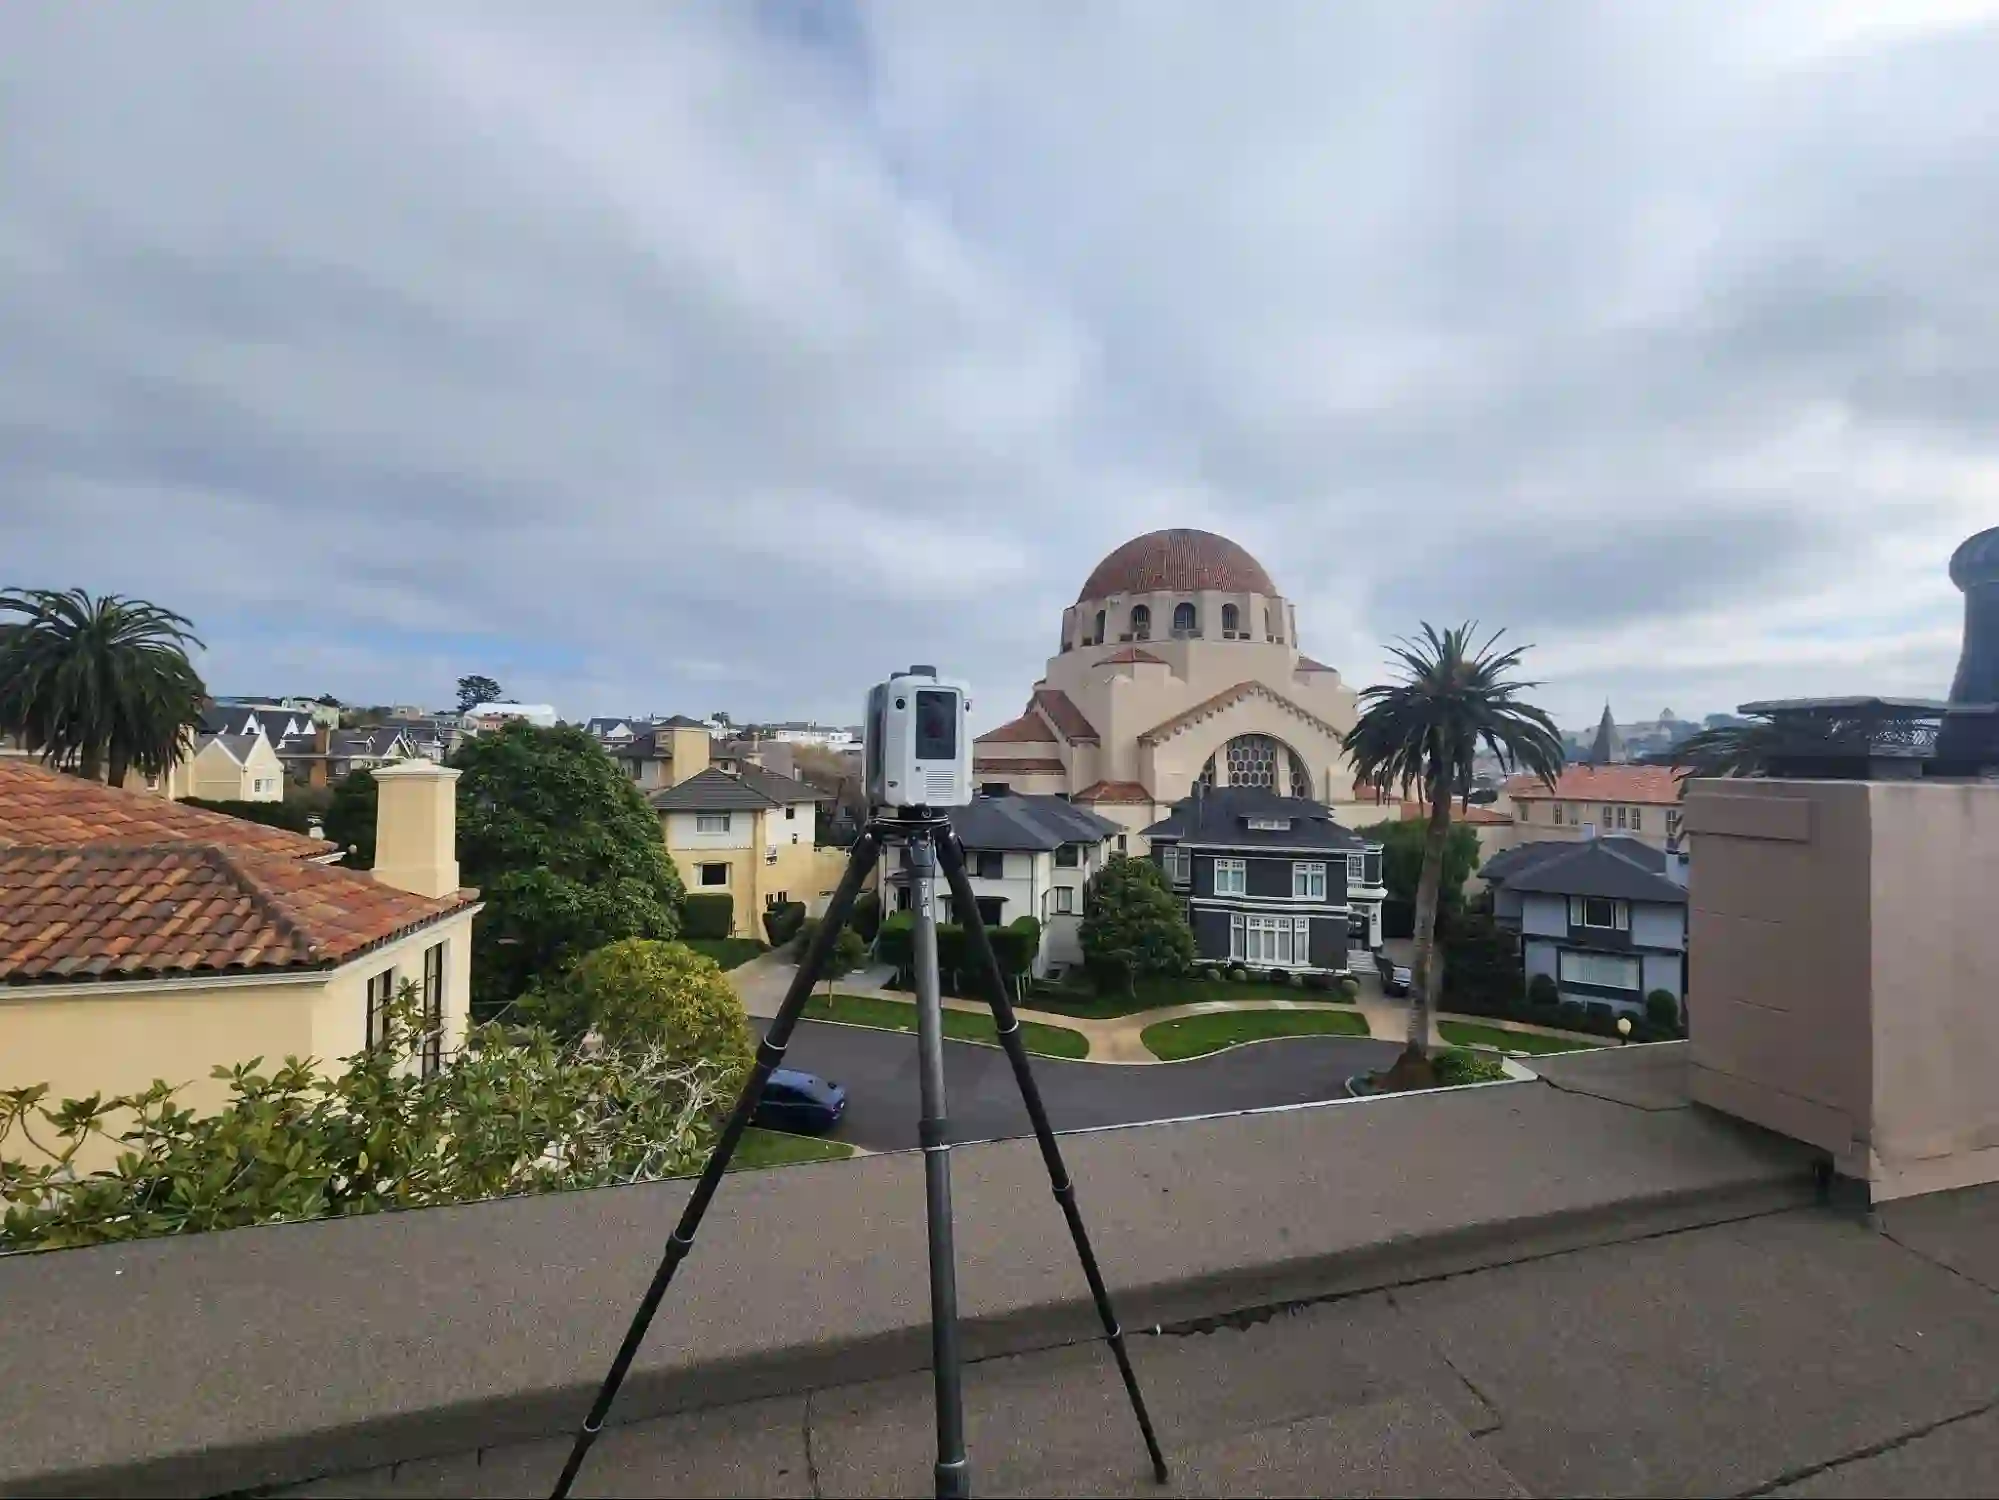
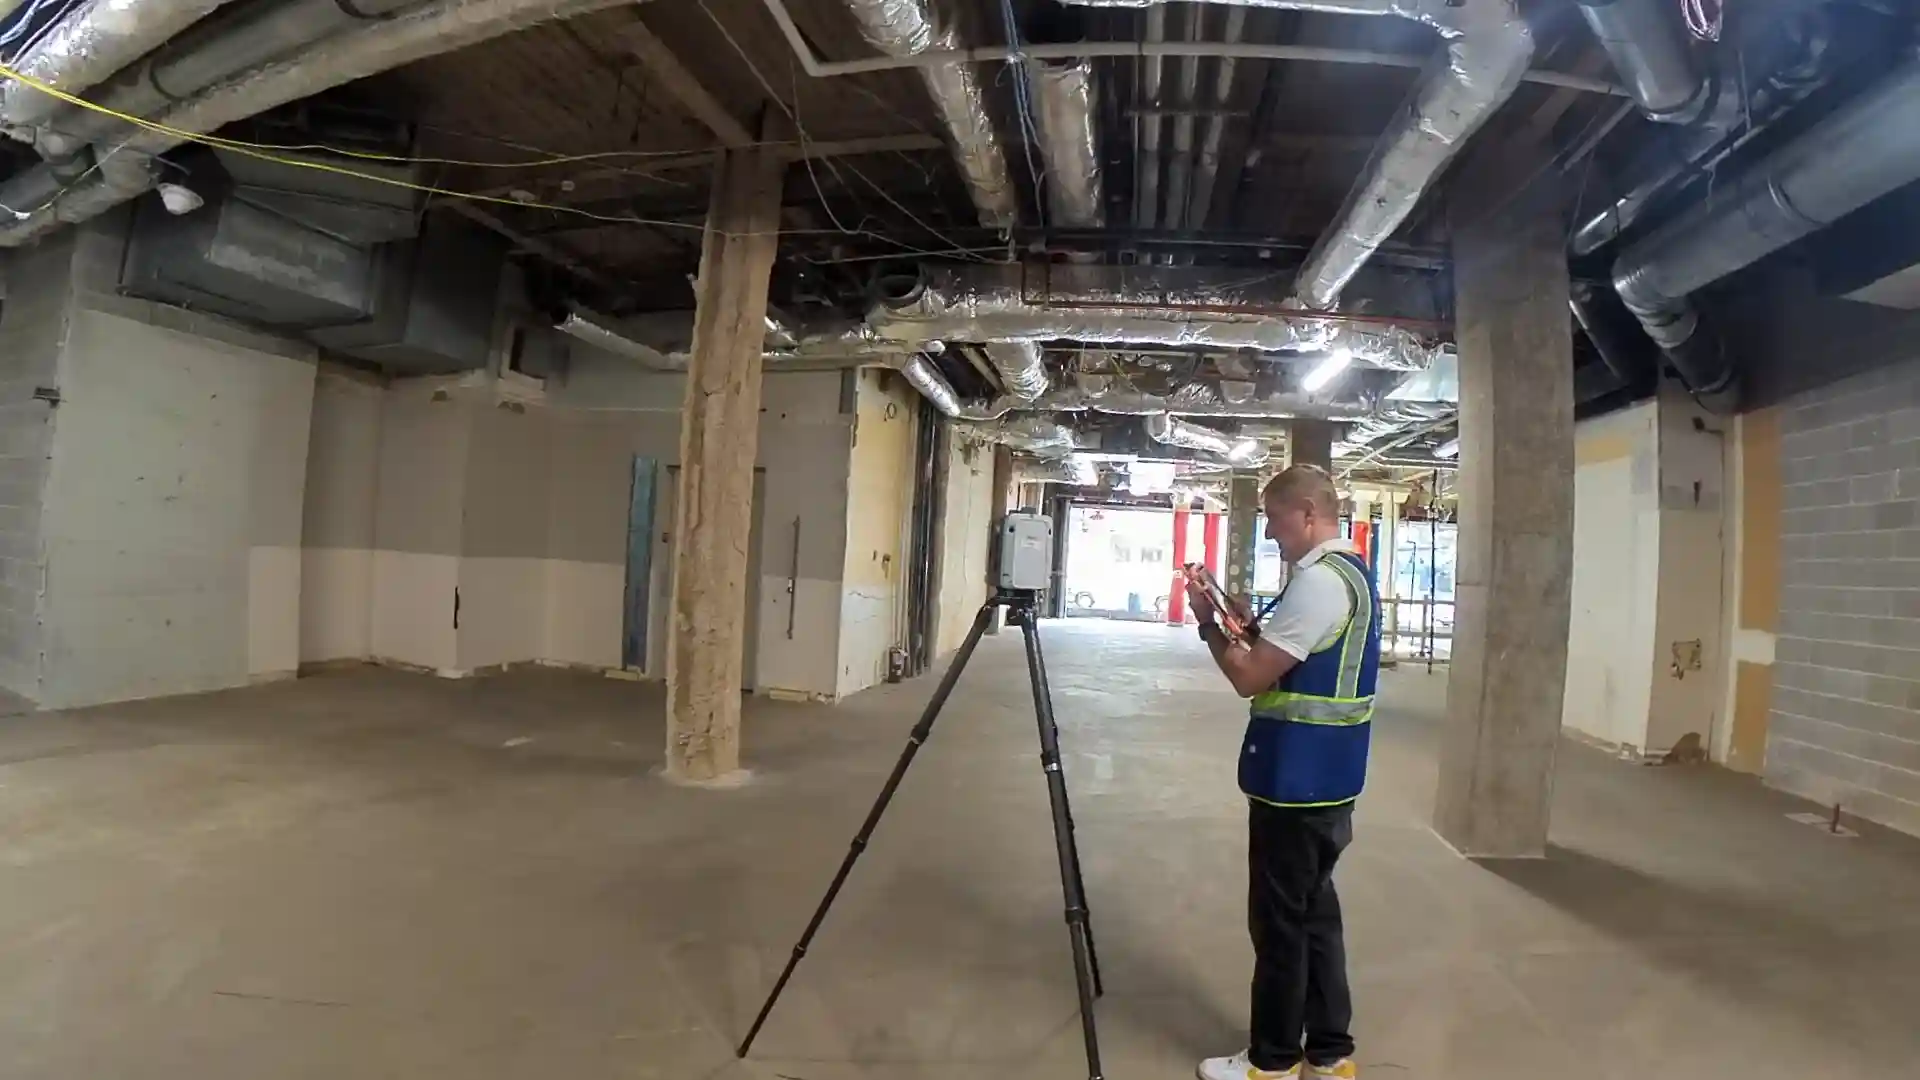
Site Scanning: Positioning and Access
Scanner placement for MEP documentation is more demanding than architectural scanning. Where a single scan position might capture a room’s walls and floor from the center of the space, documenting MEP systems requires the scanner to be positioned close to the ceiling and in multiple locations to minimize occlusion from the dense layering of duct, pipe, and conduit. Suspended ceiling tiles are removed in MEP-critical corridors and mechanical rooms to give the scanner direct sightlines above the plenum.
A floor plate that needs 30 to 40 scan positions for architectural documentation typically requires 60 to 90 positions for thorough MEP capture. Field time increases proportionally, but so does documentation completeness. The alternative, designing around assumed MEP conditions, is not a savings; it is a deferred cost.
Point Cloud Registration and Delivery
Individual scan positions are registered (aligned) into a unified coordinate system. The registered point cloud is the source dataset for all downstream deliverables. For projects requiring the raw data, we deliver the registered point cloud in formats compatible with Autodesk Revit, Navisworks, and AutoCAD products. Teams doing their own modeling can work directly from this data.
CAD as-Built MEP Drawings
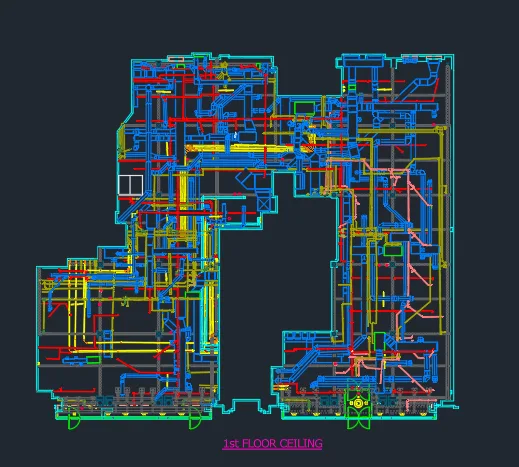
For teams that need 2D deliverables, point cloud data is converted into AutoCAD (.dwg) MEP drawings showing plan views, reflected ceiling plans, and elevations of MEP systems. Duct sizes, pipe diameters, equipment locations, and routing are all derived directly from measured scan data, not scaled from aging drawings. These files support permit submittals, coordination drawings, and TI design packages.
See our full as-built drawings service for format and delivery details.
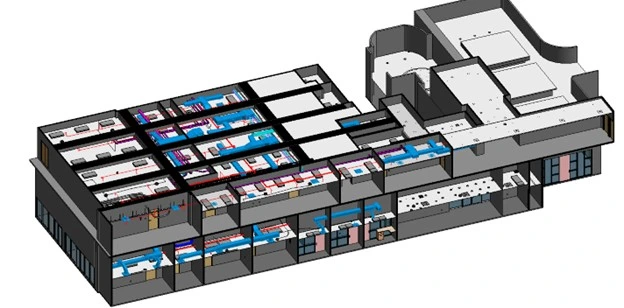
Scan-to-BIM MEP Models
For teams working in BIM, Scan-to-BIM delivers a Revit model populated with MEP elements derived from scan data. LOD is specified at project scope: LOD 200 for general documentation and space coordination, LOD 300 for accurate system routing and TI design, and LOD 350 for clash detection and MEP coordination workflows. The LOD applied to MEP systems is set independently from the architectural model, which allows teams to specify higher fidelity where the budget justifies it and lower fidelity where it does not.
Explore the full workflow on our Scan-to-BIM services page.
LiDAR vs. Traditional Methods: What the Numbers Show
The case for LiDAR-derived MEP drawings is not primarily about technology preference. It is about accuracy, schedule, and liability exposure. The table below compares LiDAR scanning against the two most common alternatives for MEP documentation on commercial renovation
| Method | Accuracy | Time on Site | Deliverable Ready | RFI Risk |
| Manual Field Measurement | ±2″ to ±4″ | 3–5 days (large floor) | 3–6 weeks | High |
| Legacy CAD Review Only | Unknown / assumed | 0 days | Immediate but unreliable | Very High |
| LiDAR Scanning (LiDAR Precise Plans) | ±2mm / ±1/8″ | 1–2 days | 5–14 business days | Low |
Manual field measurement reaches its practical limit on complex, multi-system plenums where routing geometry changes in three dimensions. Legacy CAD review produces no field-verified data at all: it tells you what was drawn, not what is there. LiDAR scanning delivers field-verified geometry that supports every downstream use: design, coordination, permitting, and facilities management.
Matching MEP LOD to Project Scope and Budget
LOD selection for MEP is where most project teams leave money on the table, either specifying too much and paying for documentation they will not use, or specifying too little and discovering the gap mid-construction. The table below provides a working reference for LOD selection based on project type.
| MEP Scope | Typical Use Case | Relative Cost vs. Arch-Only | Modeling Complexity |
| Arch-Only, LOD 200 | Space planning, general documentation | 1× baseline | Low |
| Arch + MEP, LOD 200 | Facility management, rough coordination | 2–3× | Moderate |
| Arch + MEP, LOD 300 | TI design, permit documentation | 3–4× | High |
| Arch + MEP, LOD 350 | Clash detection, MEP coordination | 4–6× | Very High |
| Full MEP, LOD 350–400 | Industrial, fabrication-level detail | 6–10× | Extremely High |
A TI project redesigning one floor of a 10-story office building does not need LOD 350 MEP documentation for all 10 floors. It needs LOD 300 on the affected floor and LOD 200 on adjacent floors where system connections may be relevant. Defining that scope precisely at the quote stage eliminates the two most common budget problems: scope creep and scope deficiency.
For a complete explanation of LOD and how it affects deliverable scope, see our LOD in BIM guide.
The Real Cost of MEP Documentation Gaps
The cost of inadequate MEP drawings is not abstract. It shows up in the project log as change orders, RFIs, and schedule extensions. A single undetected duct conflict on a commercial buildout can require rerouting 20 to 40 linear feet of ductwork at installed cost, which runs $45 to $90 per linear foot for medium to large commercial duct. That is a $900 to $3,600 change order for one conflict. A complex renovation typically surfaces between three and eight such conflicts when working from inaccurate documentation.
Beyond direct rework costs, field conflicts displace subcontractor crews. Mechanical subs working in a cramped ceiling are often the critical-path trade; when they stop to wait on a coordination resolution, every downstream trade waits with them. FMI’s research shows that schedule delays caused by poor existing conditions documentation average 11 additional calendar days on mid-market renovation projects, with owner-side carrying costs that typically exceed the documentation investment several times over.
The permit dimension compounds this further. Jurisdictions in California and Nevada increasingly require verified existing conditions drawings with TI permit submittals. A set of as-built MEP drawings that the permit checker treats as unverified adds review cycles and potential corrections. LiDAR-derived drawings arrive with a documented accuracy standard: ±2mm / ±1/8″. That precision supports plan check confidence in a way that hand-measured as-builts cannot replicate.
For a full breakdown of what bad documentation costs across project phases, see our resource on the cost of bad building documentation.
How LiDAR Precise Plans Approaches MEP Documentation
At LiDAR Precise Plans, MEP documentation is not a line-item add-on. It is a core scanning discipline. Across more than 4,200 buildings documented, a significant portion have required MEP-specific field protocols: strategic ceiling tile removal, close-range scanner positioning, and multi-pass scan sequences through dense plenums. We plan MEP scan coverage at the project scoping stage, not as an afterthought.
Our MEP deliverables ship in whatever format the project demands. For design teams working in Revit, we produce LOD-specified Scan-to-BIM models with MEP systems modeled to your stated LOD: 200, 300, or 350. For teams that need 2D, we deliver AutoCAD .dwg files with plan, section, and elevation views of all documented MEP systems. For teams managing the BIM work internally, we deliver the registered point cloud in Revit-ready format, along with all scan data.
Turnaround runs 5 to 14 business days, depending on building size and MEP complexity. Quotes return within 24 hours. We serve commercial, industrial, hospitality, and historic preservation projects across Las Vegas, Phoenix, Los Angeles, San Francisco, Denver, Salt Lake City, and Austin.
Explore our MEP documentation service or our full 3D laser scanning services to see how scan data is collected and what format options are available for your project type.
LiDAR Gives MEP Documentation a Ground Truth It Never Had Before
Every renovation project, tenant improvement, and MEP coordination workflow runs on one foundational assumption: the existing conditions drawings are close enough to trust. LiDAR scanning replaces that assumption with verified field data. MEP drawings produced from scan data reflect what is in the building now, at ±2mm accuracy, not what was installed 20 years ago and never updated.
For architects absorbing coordination risk, for GCs holding contingency reserves against field conflicts, and for facility managers supporting capital planning decisions, the switch from estimated to verified MEP documentation is not an upgrade: it is a risk reduction strategy that pays for itself when the first conflict that was not there gets avoided.
Ready to Replace Assumption with Accuracy?
LiDAR Precise Plans delivers verified as-built MEP drawings in 5 to 14 business days, with ±2mm / ±1/8″ documented accuracy. Request a quote within 24 hours.
Frequently Asked Questions (FAQ)